Release manager dashboard
The Release Management dashboard is meant to provide an at-a-glance overview of the current state of the entire release process.
This document gives an overview of each of the panels on the dashboard, what they mean, and when they require attention.
Panels
At the top of the dashboard is a Summary row, which provides a high-level overview for all of our critical environments (Staging, Canary, and Production).
Environment versions
These six panels represent the version of GitLab Rails and the version of the Omnibus package running in each environment.
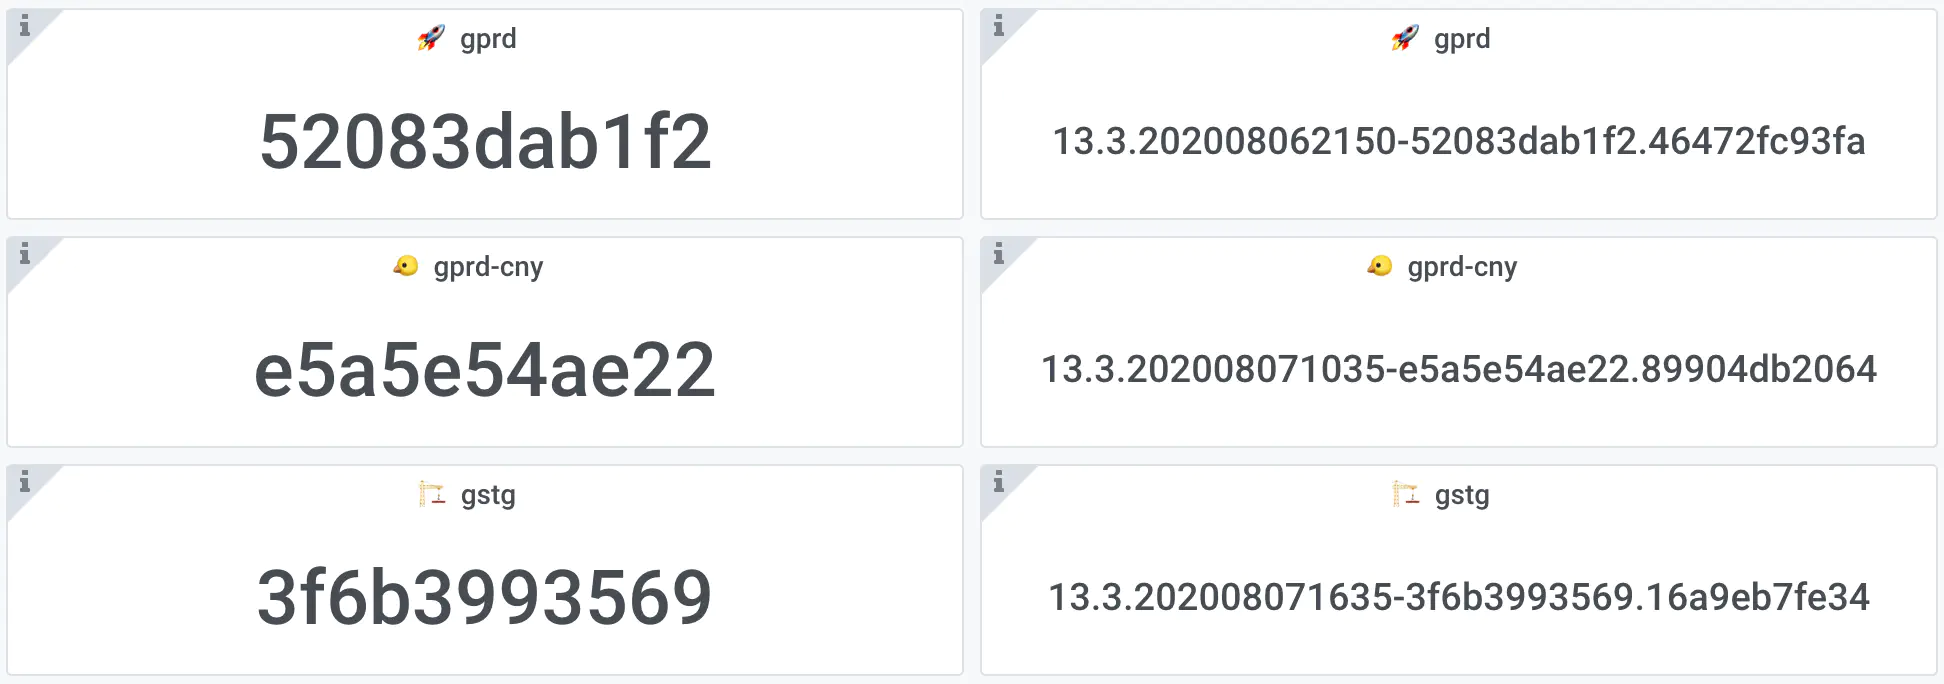
In this example, we see that the gprd environment (gitlab.com) is running GitLab EE
52083dab1f2, and
Omnibus
13.3.202008062150-52083dab1f2.46472fc93fa.
gprd-cny (next.gitlab.com) is running e5a5e54ae22 and
13.3.202008071035-e5a5e54ae22.89904db2064.
gstg (staging.gitlab.com) is running 3f6b3993569 and
13.3.202008071635-3f6b3993569.16a9eb7fe34.
This information is mostly useful to see where a particular version is in its progression to gitlab.com.
NOTE: These versions are determined by the majority of hosts running the same version. As a deploy progresses, these versions will change before the deploy has actually completed.
Auto-deploy pressure
This panel shows the number of commits in the main branch of GitLab EE not yet deployed to each environment.
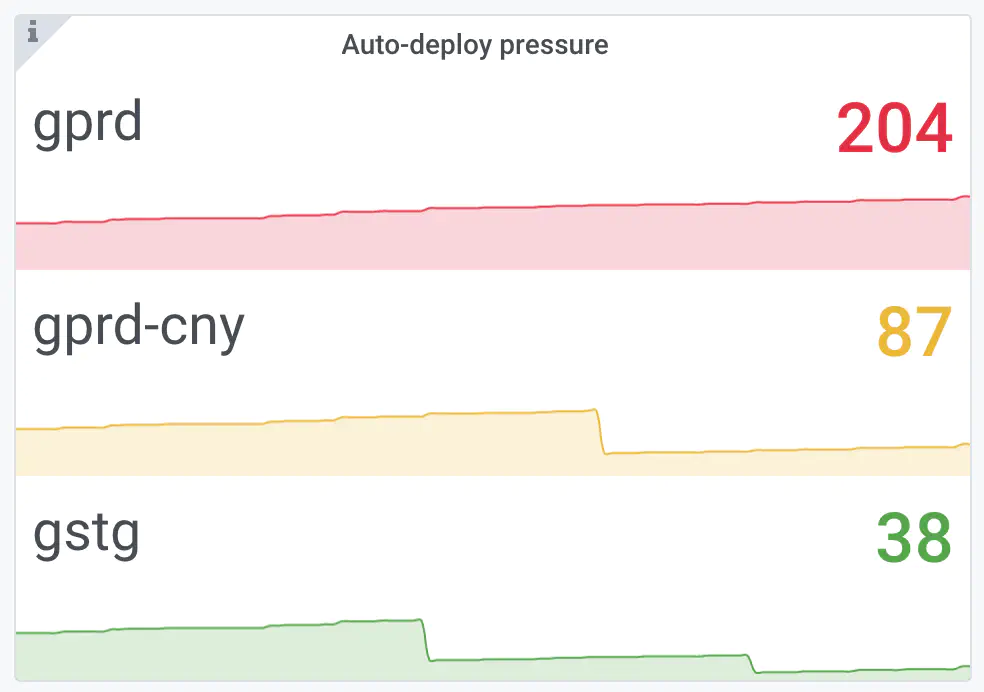
In this example, Staging is 38 commits behind gitlab-org/gitlab@master;
Canary is 49 commits further behind that for a total of 87; Production is
117 behind that for a total of 204.
Due to automated Staging and Canary deploys, those two metrics will generally stay below 100 unless something is wrong with automated deploys. If the metric for those two environments is higher, there may be an issue with automated deploys, or something maybe preventing them.
If there are deployment blockers for Production, that metric will typically go between 200 and 350. A value higher than that will likely correlate with negative impacts on our Mean time to production (MTTP) metric.
New Sentry issues
This panel shows the number of “new issues” in Sentry for the version currently running in each environment.
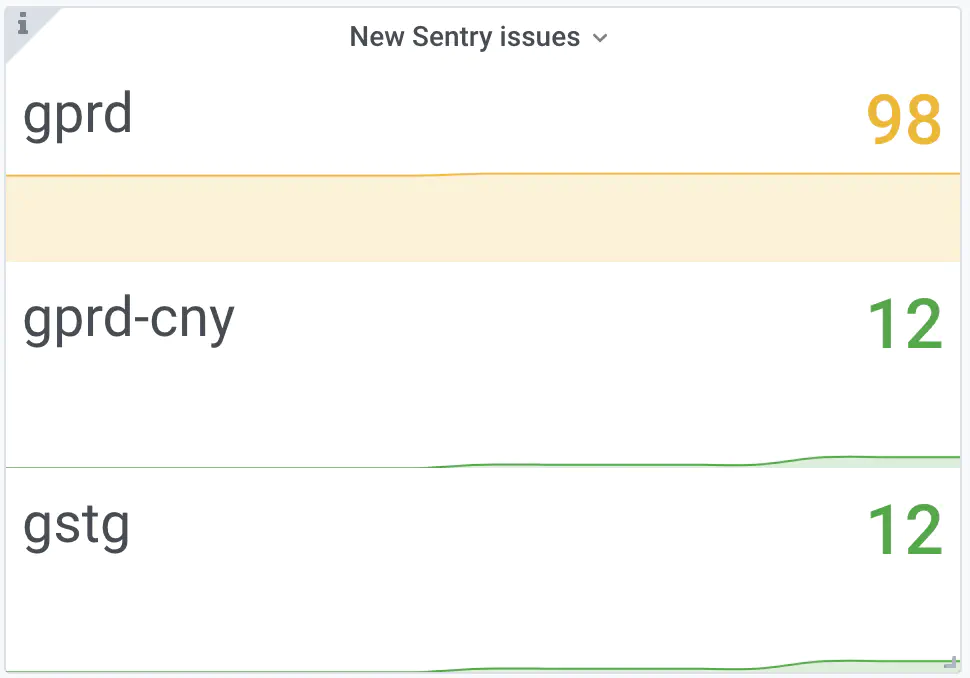
In this example, Staging and Canary are running the same version and have seen only 12 new issues; Production is running a different version and has seen 98 new issues.
If this metric increases sharply after a particular deploy, it may indicate that a bug has been introduced in the version running on that environment, and should be investigated.
Every release will see this metric grow slowly over time due to the way Sentry identifies unique issues, and the nature of our error tracking. It’s perfectly normal for a revision that has been running for multiple days to see 300-500 “new issues”.
Release pressure
This panel shows the number of merge requests for each monthly release waiting to be included in a patch release.
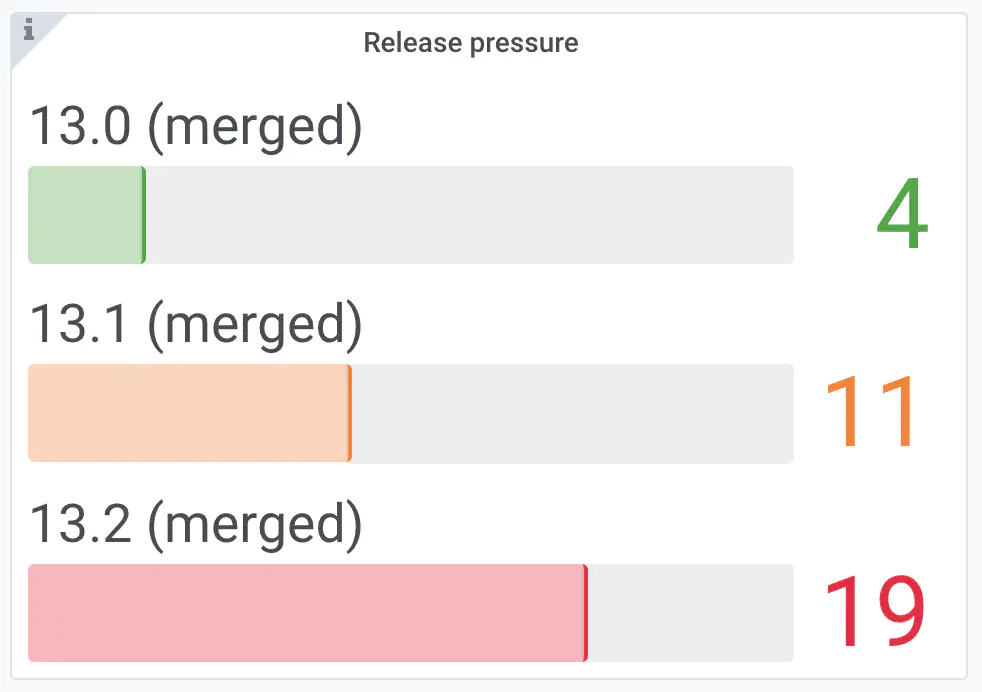
In this example, there are 19 merge requests waiting for a new 13.2 patch
release, 11 waiting for a 13.1 release, and 4 waiting for a 13.0
release.
For the most recent release, a patch release is likely warranted for anything over 5 merge requests. For older releases, we might put off a patch release until the pressure is higher.
Environment-specific panels
After the Summary, each environment has its own row of environment-specific metrics.
These panels support the deployment annotations which can be toggled at the top of the dashboard:

Toggling these on will show corresponding annotations on the environment-specific graphs to indicate when a deploy to that environment occurred.
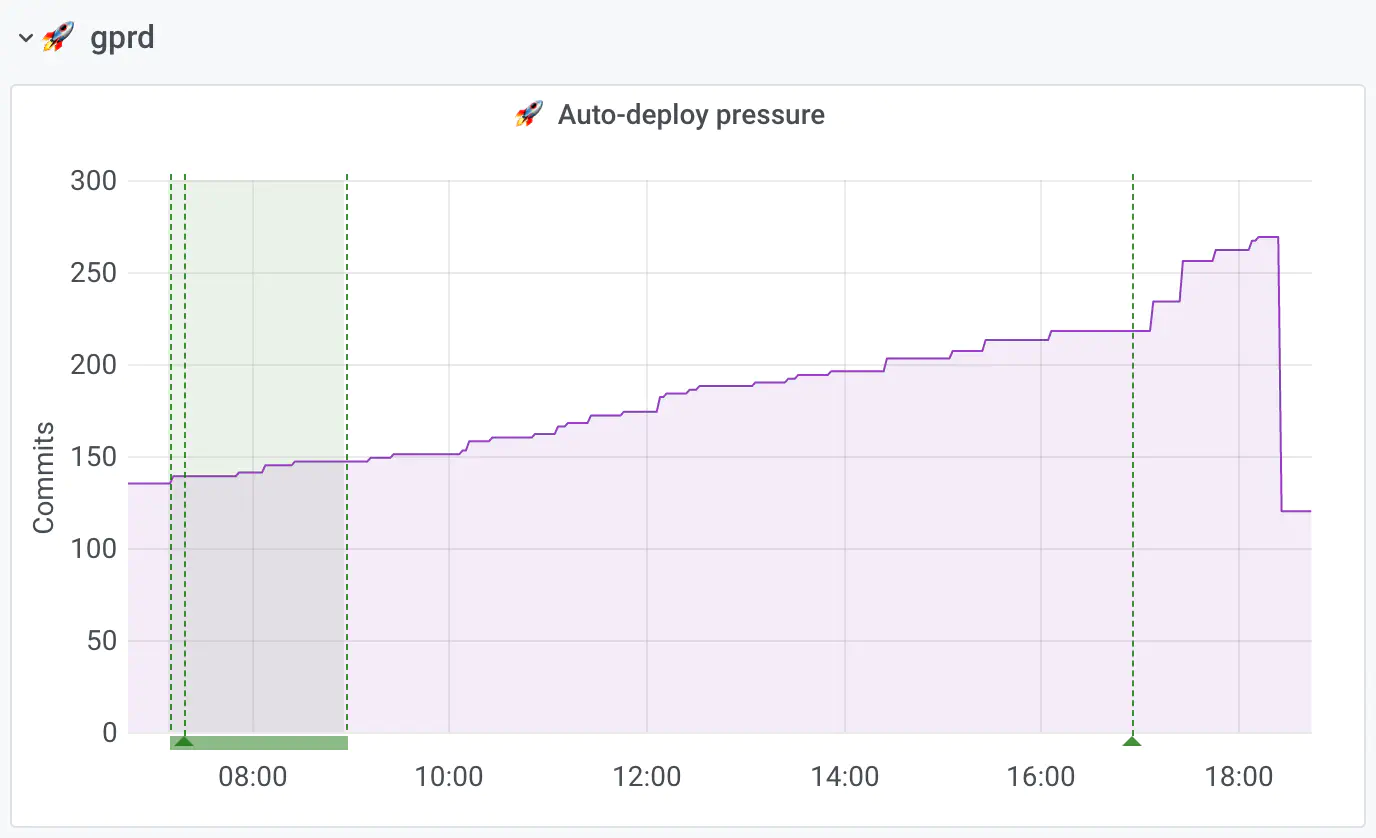
In this example, the shaded area above 08:00 indicates a Production deployment began and then completed over that time period. The arrow and vertical dotted line on the right (around 17:00) indicates that another Production deployment has started but has not yet completed.
Development
The dashboard is generated with Grafonnet and is source controlled in the runbooks project.
See the Release manager dashboard epic for more information.